The Combo Deal: Navigating Growth and Declines
- Note from the CIO
- Investment Management

As we reflect on another strong year in the equity markets, we remain steadfast in our pursuit of helping clients achieve their lifetime goals. The journey towards these goals requires not just a commitment to sound investment principles, but a deep understanding of the inherent risks and rewards in the markets.
Our investment philosophy is simple and enduring:
- We are long-term, goal-focused investors who build broadly diversified portfolios of high-quality businesses.
- We recognize that the economy is unpredictable, and market timing is impossible. Therefore, the only way to capture the premium long-term returns of equities is to remain invested through the inevitable, but historically temporary, declines.
- We do not react to short-term market movements or economic events. As long as your long-term goals and life circumstances remain unchanged, so too will our strategy to achieve those objectives.
As we begin a new year, it's a natural time to revisit long-term financial plans. One of the common questions we receive during this process is: What investment returns should we assume for the future? To answer this, we often frame it this way:
10%, -14%, -33%
These numbers encapsulate the expected long-term growth of equities and the inevitable volatility along the way. Let’s break them down:
- 10% Growth1 – This is the average annual return we expect from equities over time. It’s the premium that equities offer over cash and bonds. But why do equities deliver this higher return? Simply put, it’s the compensation you earn for enduring the risk of significant declines that can occur along the way.
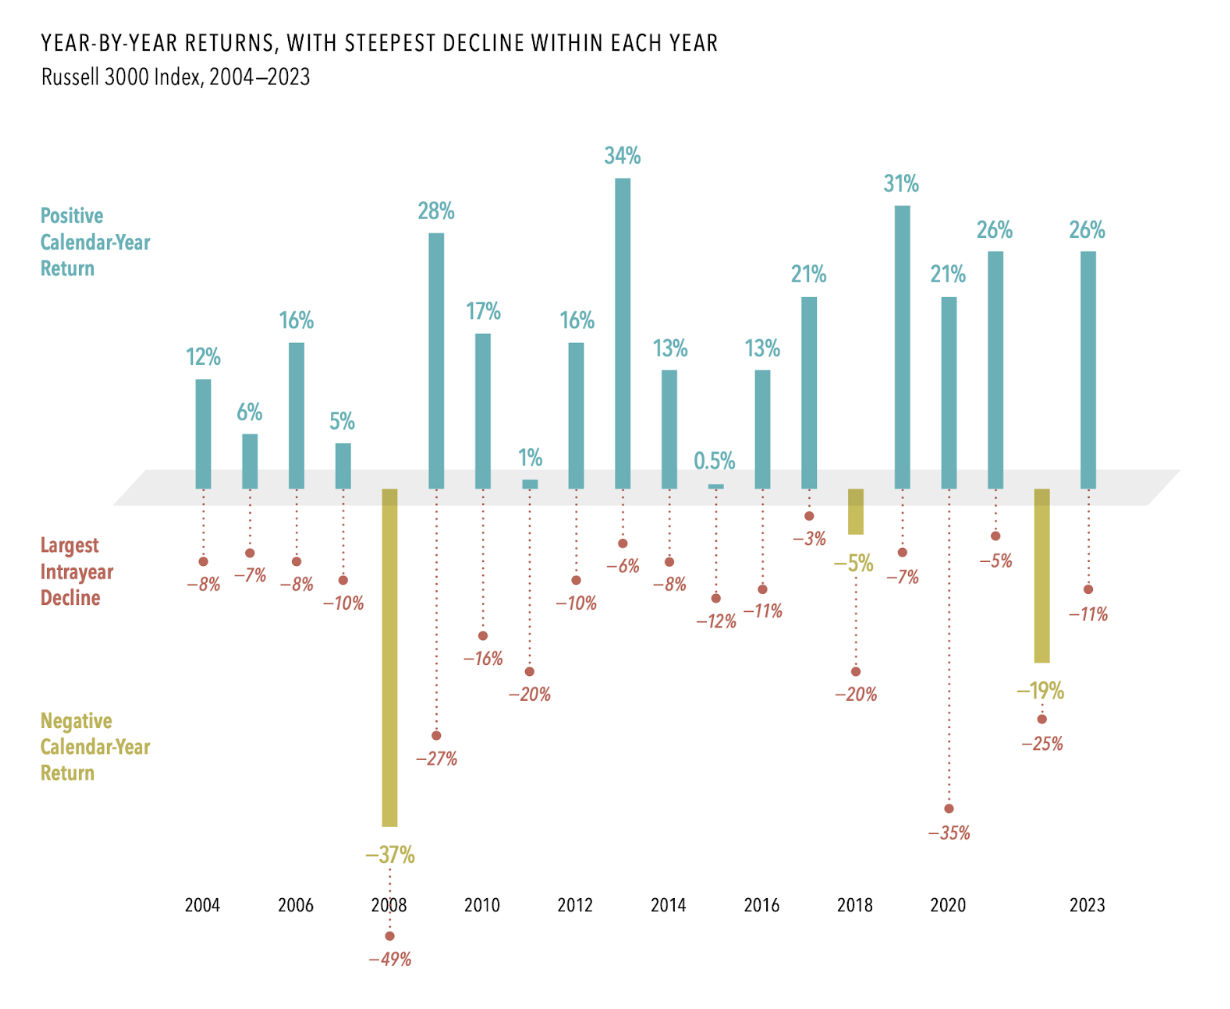
- -14% Intra-Year Decline2 – On average, during any given year, equities experience a peak-to-trough decline of about 14%. This figure is important because it underscores the volatility investors must endure in order to realize the long-term growth equity markets can offer. Interestingly, despite these annual dips, 75% of calendar years have positive returns.
- -33% Bear Market Decline3 – On average, equities experience a bear market—defined as a decline of 20% or more—roughly once every five years. The depth of these bear markets tends to be significant, with an average decline of 33%. In the 21st century alone, we’ve seen two bear markets with losses near 50%.

This, in essence, is the "combo deal" we face as investors: the expectation of 10% growth, alongside the inevitability of 14% intra-year corrections and 33% bear market declines. They are inseparable. You cannot expect the returns without also accepting the volatility that comes with them.
However, when these declines occur—and they will—it's crucial to remember they are not derailments. In fact, they are built into our financial plans. Without these declines, the 10% historical average return would not be possible. They are an essential feature of the market's structure, driving the premium that equities provide over time.
It's important to note that the 14% decline will not happen precisely every year, nor will bear markets always fall exactly 33% twice every decade. These are averages, not certainties. But the fact remains that significant declines are a part of the market’s natural cycle.
Through it all, the resilience of companies and economies has been a powerful force for recovery. Over the long term, these declines have always been temporary, and equities have historically continued their upward trajectory.
As we plan for the future, we must plan for both the growth and the declines. The combo deal is not a burden, but a necessary and expected element of long-term investment success.
- Dimensional Returns Web. S&P 500 return from 1/1/1926 to 12/31/2024 was 10.46%. ↩
- JPM Guide to the Markets, slide 16 ↩
- Data from Macrotrends.net ↩
DISCLOSURE: Quantum Financial Advisors, LLC is an SEC registered investment adviser. SEC registration does not constitute an endorsement of Quantum Financial Advisors, LLC by the SEC nor does it indicate that Quantum Financial Advisors, LLC has attained a particular level of skill or ability. This material prepared by Quantum Financial Advisors, LLC is for informational purposes only and is accurate as of the date it was prepared. It is not intended to serve as a substitute for personalized investment advice or as a recommendation or solicitation of any particular security, strategy or investment product. Advisory services are only offered to clients or prospective clients where Quantum Financial Advisors, LLC and its representatives are properly licensed or exempt from licensure. No advice may be rendered by Quantum Financial Advisors, LLC unless a client service agreement is in place. This material is not intended to serve as personalized tax, legal, and/or investment advice since the availability and effectiveness of any strategy is dependent upon your individual facts and circumstances. Quantum Financial Advisors, LLC is not an accounting or legal firm. Please consult with your tax and/or legal professional regarding your specific tax and/or legal situation when determining if any of the mentioned strategies are right for you.
Please Note: Quantum does not make any representations or warranties as to the accuracy, timeliness, suitability, and completeness, or relevance of any information prepared by an unaffiliated third party, whether linked to Quantum’s website or blog or incorporated herein, and takes no responsibility for any such content. All such information is provided solely for convenience purposes only and all users thereof should be guided accordingly.
For more information about Quantum and this article, please read these important disclosures.
- Note from the CIO
- Investment Management
Darius Gagne, PhD, CFP®, CFA
Darius Gagne is the Chief Investment Officer of Quantum Financial Advisors, LLC. Darius is also a Financial Advisor directly to clients and a founding partner of the firm.
Read More


